Putting ERP to Work in Higher Ed
with Jason Shaffner
Examining the ongoing challenges of delivering high-quality, value-added ERP services in Higher Education.
Sunday, August 19, 2012
Spinning Wheel of Death
What fun we had last week trouble-shooting predictably unpredictable failures on our OBIEE development environment. It all began with Noetix, a set of pre-packaged content for Oracle E-Business Suite Financials that we acquired to jump-start our transition to modern BI tools. (But it was not really Noetix' fault, as you'll see).There were some new roles (as expected) and an RPD to merge (no biggie) and some catalog content, too (par for the course in multi-user development). All things we will face again and again in our future as multiple development teams author content for thousands of users.
For roughly 38 minutes after the install was done, everything looked great. And then we saw the following behaviors:
- Perpetual spinning icon when trying to open the Dashboards Menu
- No response (not even a browser error) when selecting New > Dashboard
- Permissions error when opening ANY Dashboard object (not only new merged content)
Attempting to open any Dashboard prompted this error:
This message-- seemingly a failure related to one of the roles created during our Noetix installation process -- cried out for corruption somewhere... We started by scouring the permissions on Dashboards features: everything was fine. Checked the policy store in Weblogic / Enterprise Manager: looked fine. Checked the permission on catalog content; tweaked the settings -- problem solved! For 38-41 minutes, upon which I saw this, again:
We reverted to our RPD: no luck. Reverted to old RPD: spinning, spinning, spinning. Restarted services. Bounced servers. Cleared caches. Any "fix" we thought we found lasted 40 minutes.
Finally, we found relevant articles on My Oracle Support:
- Oracle Support Document 1390497.1 (How To Clean Corrupted Permissions On An Upgraded OBIEE 11g Presentation Server Catalog)
- Oracle Support Document 1388837.1 (OBIEE 11g: Clicking on "Manage Privileges" Throws
- "Error retrieving user/group data from Oracle BI Server's User Population API")
Problem solved; onward to new problems next week!
Labels: OBIEE, Oracle, Oracle BI
Monday, August 13, 2012
Dynamic Metric Selection from Prompt
There is a saying: "never use two words when one can suffice." Sometimes it seems that with Oracle BI (OBIEE) they have a different view: why provide one way to do something when six can suffice. At the minimum you have to deal with the semi-redundant functionality of the BI Publisher and Legacy Siebel feature sets. But even within those tools there is often more than one way to implement a given feature.Imagine that you have this requirement: provide the end user an option for which metric to include in a table or graph. A common use case would be to toggle between order volume (# of transactions) and revenue ($).
The most obvious way to do this within Oracle BI is to use the "Column Selector" view. This is easy and fairly obvious.
1. Create your analysis with one metric.
2. From the Results Tab, insert a new view -- Column Selector.
3. Click the checkbox next to the metric you already chose, then double click other metrics from the subject area navigator to add them to the list.
4. View the report and note the drop-down for the user to choose the metric he prefers. (Below is a screenshot with two views on one dashboard).
But that does not seem to be Oracle's preferred method... Presuming that your plan is to deploy Analyses mostly via Dashboards, the recommendation seems to be to configure Dashboard Prompts and utilize Presentation Variables. This is pretty slick, especially in combination with the "go-less prompt" style of removing the Apply button. It isn't straight-forward and it does have some drawbacks, but it is a useful method to know!
1. Configure your analysis with the dimension columns and a single measure.
2. Edit the formula for the measure, entering syntax that presumes a presentation variable "{Met01}" but defaults to something (here: revenue)
Resulting column shown below...
3. Create a Dashboard Prompt.
4. Add a prompt for "Metric" -- the trick here is to replace the member formula with a fake text value -- '1' or something like that (see below)
5. The next trick is to bypass the normal way of adding members to the prompt -- since we are not using a real prompt, we need to trick the system; click the pencil icon in the upper right of the screen.
6. (Above) Key in member names from the fact table(s) of the subject area for this report. This has to be perfect -- I find it easiest to have two tabs of the same OBIEE instance open in Firefox and toggle between them.
7. Establish a default (although your query will default if you followed the above example) and define the presentation variable to be set as a result of the user selecting a value; name it "Met01" since that's what you assumed earlier!
8. Create a new Dashboard and drag the prompt and report into the body.
9. Run the report; select each radio button to see the view(s) refresh.
(And below, after toggling the prompt value...)
So that's pretty slick, and definitely the way to go if you will embed multiple analyses on a single Dashboard. My top concern -- although I would not be surprised to learn there is a fix for this -- is that the column selector has the added advantage of also toggling the column heading, whereas in the prompt/pres-var solution the column heading is something generic such as "selected metric." Nevertheless, I think I'll be teaching this trick to my team next week!
Labels: Business Intelligence, OBIEE, Oracle, Oracle BI, Tips and Tricks
Friday, August 10, 2012
Nifty Trick for Dimension Tool Tips
Not all users will remember the meaning of each dimension or even the values within that dimension. I found this simple (and not at all obvious or intuitive) trick buried deep within the OBIEE 11.1.1.6.2 BP1 Sample App, on Dashboard 3.21 (Other Tips). In a nutshell, the trick is to use the Data Format field on an Analysis column to embed a "tooltip" to enlighten the end user during mouse-over. What's even better is that it is also possible to quickly apply the Tool Tip universally to the column if you so desire!
This is quickie... Don't blink or you'll miss it.
1. On the Criteria tab of a new or existing analysis, invoke the menu for a column and choose "Column Properties"
2. On the "Data Format" tab of the Column Properties modal window, check the "Override Default Data Format" box and choose "Custom Text Format" in the drop-down for "Treat Text As" and enter HTML as shown below. In this text, the @ will be replaced at run-time with the name of the member (even though the same tip will appear for every member of the dimension).
3. To apply this universally to the column, click "Save as Default" at the bottom of the window and select the second option.
4. The completed configuration is shown below with some incredibly pithy text.
My one additional observation here is that as I dig into OBIEE I keep realizing the endlessness of the configuration options. One problem is knowing where to draw the line. Another problem is the lack of clear documentation on the variables that can be used within the HTML embedded in all these properties! I feel as if an entire style guide needs to be written! (And unfortunately, I'm not the guy to do it...)
Labels: Business Intelligence, OBIEE, Oracle, Oracle BI, Tips and Tricks
Wednesday, August 8, 2012
Nifty Trick for Emphasizing OBIEE Actions
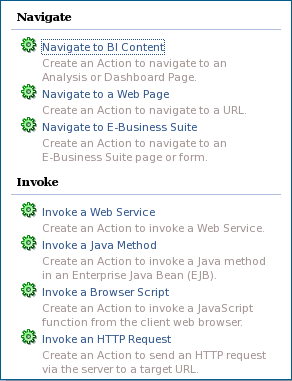
I'm a big fan of the Action Framework in Oracle BI (OBIEE) 11g. This feature allows a report designer significant flexibility for "actionable intelligence" (another of Oracle's names for this feature along with Agents, in fact) including guided navigation from a cell on a report to relevant content. With a broad set of options, including: navigation to websites, invoking a web service, calling a Java method or intiating JavaScript, posting to an HTTP form. The Action Framework also is the primary mechanism for integrating one Analysis (Answers) query to another and opening relevant reports or forms in Oracle Hyperion EPM, Oracle E-Business Suite, or Siebel CRM. So it has a lot going for it, right? Did I mention that it is one of the more straight-forward configuration items in OBIEE? |
| Caption: "New Action" pop-up from the 11.1.1.6.2 BP1 Sample App; note that in this environment the options for EPM and Siebel have not been configured. |
Once an action has been configured, there are basically four ways it can be invoked:
- Directly from the Web Catalog UI
- Directly from a Dashboard
- Within the context of a scheduled Agent
- From an "Action Links" menu embedded in an Analysis
The last of these is probably the most valuable, especially since it allows for the passing of relevant context from the cell the user picked.
In the above screenshot, for example, the term "Baseline Operations" will automatically be sent as a search criterion to our Confluence knowledge base if the user clicks "Search FSS Confluence for Definition" (a "Navigate to a Web Page" action) or the quarter and category will be passed to another BI Analysis report if the user clicks "Analyze Category in Detail." This works great... With one minor problem: there is NO indication to the user that navigation is possible from that cell. In many other cases, the default action would be a drill into details. This has the potential to confuse users.
And then I came across this nifty little trick when perusing the catalog in the latest OBIEE Sample App. See below:
The additional column "Actions" is used only for the purposes of exposing the Action Links menu. How do do it? Simple.
1. Create an analysis with dimensions and measures
2. Add ANY additional dimension to the end of the layout. It doesn't matter which one you choose; it won't get used.
3. Open the menu on the extraneous column and choose "Edit Formula"
4. Click the "Custom Headings" checkbox and overwrite the Folder and Column Heading with the text for the column in the report.
5. (Above) In the "Column Formula" field replace the contents with the hyperlink text (with single quotes around the text).
6. Configure the Action menu by opening the menu on the "Action" column and choosing "Column Properties."
7. On the "Interaction" tab choose "Action Links" as the "Primary Interaction."
8. Configure the links, either from a library of pre-configured Actions or by defining new ones.
9. Run the report and see your links in action!
Pretty slick little trick, if you ask me! I'm not saying you should use it every time, and I know it is a little busy, but a useful trick to have up your sleeve, especially if a client asks for something like this!
Labels: BI, Business Intelligence, OBIEE, Oracle, Oracle BI, Tips and Tricks
Monday, August 6, 2012
OBIEE Analysis as BI Publisher Data Source
BI Publisher Enterprise is a very powerful tool, especially because it can access so many different data sources without the burden of data modeling. By going around the RPD layer, BIP can access transactional data sources directly, which makes it an excellent option for replacing existing operational reports. BIP's powerful and flexible formatting including WYSIWYG parity between report layout and report output ("pixel-perfect" is another way to say this) make it a far superior tool to Analysis (Answers) or Dashboards for producing printable output.But there are some compelling features about Analysis (Answers) that you may want to retain, including all that security you've spent so much time building into the repository (RPD). That alone may be a compelling reason to want to layer BIP on top of BI Analysis. But also consider these justifications: 1.) The ease of building queries in Analysis (Answers); 2.) the potential for "multi-use" for a single query -- perhaps you also want the data in a Dashboard as well as in a printable format.
On the face of things, this seems like a straight-forward integration. Right there in the Data Model configuration screen there is an option to use BI Analysis as a data source. Unfortunately, Oracle has made some design decisions that make this option less than perfect... Below I will walk you through the challenges of the provided integration and suggest an alternative path to meeting your requirements.
First, let's have a look at the query I created, which merges some customer indicative data along with revenue and order count by year.
Now let's look at the Advanced Tab for a moment -- especially the SQL generated by my query. I'll copy this and save it in Notepad for now... You'll see why in five minutes...
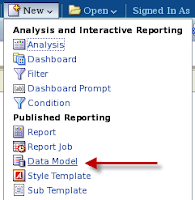
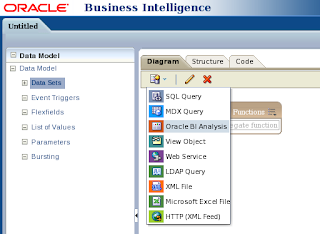
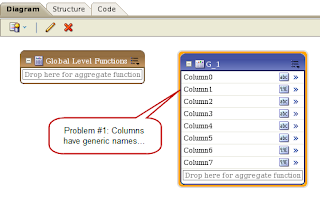
Now over to BIP, we create a new data model, choose BI Analysis as the data source, and voila -- there's my data model. With one little problem -- what is "Column1"? All columns are brought over with generic text.
 |
| Create New Data Model |
 |
| Create Data Source "Oracle BI Analysis" |
 |
| Navigate to the Analysis (Answers) Query |
 |
| Imported Metadata from Analysis query |
I can fix this problem by going to the "Structure" tab and revising the XML Tag Name to match the "Business view Display Name" at the far right. See below.
This alone would not be a major deterrent to taking advantage of the integration. However, it is not the only limitation... Back on the Diagram tab I should have some flexibility to restructure the XML. Note that for this data model, the only options available to me are Properties and Help. Options to create a group or define a link to another structure are not available.
This is by design and documented in section 2.8.1 of the Oracle Fusion Middleware Data Modeling Guide for Oracle Business Intelligence Publisher 11g Release 1 (11.1.1). But I am not satisfied with this outcome, and I have another idea. Remember that SQL we copied from the Advanced Tab of my initial Analysis (Answers) query? Let's put that to use. Back on the Data Model screen, I will initiate a new SQL data source and use the Analysis SQL (with slight modifications).
Now when I try to manipulate the columns in my data structure I have complete flexibility -- note the additional options.
Below is a fully restructured XML diagram, with the customer indicative data pulled up (along with a grand total) and then detailed annual figures collected as children. This XML will be much easier for me to use in the report I want to build!
One other quick point of information... I have used this technique extensively in one of my applications, but found that a helpful companion configuration is to define an Agent for the original Analysis for the purpose of cache seeding. If the data is in the cache, the BIP reports are lightning fast with the SQL against the presentation layer!
Labels: BI, Business Intelligence, OBIEE, Tips and Tricks
OBIEE How-To Posts Coming
As those of you who follow me on Twitter may know, my team is trying to gain traction with an implementation of Oracle Business Intelligence (OBIEE). This has proven difficult for myriad reasons I need not get into here, but I have established bold and aggressive goals for replacing our existing reporting tools (for the communities we serve: finance, research administration, capital planning, student financials) over the next 16 months. I am taking an active, hands-on role in the project, including some light dabbling in solution design.I tell people that Oracle BI is like the LEGO Star Wars Star Destroyer kit (see below for image, click here to buy from Amazon). It is an awesome toy, intricate and complicated, and looks great sitting on your dining room table at home...
Figuring out how the pieces go together has become my latest off-hours avocation. The OBIEE Sample App has proven invaluable, as have blogs from Gerard Nico and Rittman Mead and the Learning Center from Performance Architects. The Oracle documentation has its moments, too, believe it or not!
Over the next few days, I will be posting an assortment of things I've learned -- usually after coming up empty on Google! I am hoping to "pay it forward" a bit in this domain; perhaps one or two of my observations helps somebody out there put a few more pieces together.
Labels: BI, Business Intelligence, LEGO, OBIEE
Wednesday, August 1, 2012
Customers vs. Users
At some point, most IT leaders or practitioners will run up against the conflation of the terms “customer” and “user” within the context of managing a program, project, or service. This is especially true for those of us who cut our teeth implementing business applications such as ERP or Student Information Systems. On the one hand, during those projects we tend to involve large numbers of end users in the requirements, design, and acceptance testing process; these activities tend to give their participants the opportunity to define the solution. We take our cues from them and tend to want to make them happy; to the business systems analyst or functional consultant these end users are without question "the customer.”
But the harsh reality is that most of those end users do not pay the bill, so to speak. According to several management frameworks -- most notably the IT Infrastructure Library (ITIL), at least in my world -- the term "customer" should be reserved for those who pay; such an entity often represents the interest of many end users, and may or may not be a user herself, but critical differences in priorities, needs, and influence exist. For example, users may desire additional features but the customer may not want to pay a premium for those features. Unfortunately, service providers are often stuck in the middle. To exacerbate the problem, there may be cases where the (paying) customer refuses the surcharge but delivers the message to their users in a way that ascribes blame to the service provider rather than own up to her decision(s).
The problem of differentiating customers versus users can be especially acute for those individuals serving in the perhaps-misnamed function of "customer service." These folks may never have a direct interaction with the Big C Customer, but instead stands on the front-line fielding complaints, concerns, and issues (and occasional praise) from the users, the actual consumers of the service we provide. People in customer service roles often land there by virtue of a passion for helping people and solving problems. Their relationship with the user community is tangible and grounded; in the same way they seldom interact with customers, their managers and managers' managers seldom interact with the users. This disconnect presents real challenges, especially when organizations start rolling out IT Service Management and try to re-align processes and functions to meet the boilerplate from the Crown.
At a recent all-day retreat for my organization, we had a group activity on stakeholder mapping. It was not entirely successful, except insofar as it cast light on this divide. In fairness, we face a few (not quite) unique challenges that make a complicated problem worse. First, the issue of being an internal service provider. We are a pure cost center; no revenue flows into my organization. In such a context, we cannot define "customer" by virtue of bill-paying criteria. But we ought to be able to think in terms of leadership, right? Except that our institution is extremely decentralized. And unbalanced: not all organizations are created equal. Some organizations (the schools, in our case) indirectly pay (via a central assessment) for our services, whereas other units in Central Administration, funded from that same tax, receive the services "for free." And then there is the issue that in some cases we provide services on behalf of another unit in Central Administration. So is that unit -- and that unit only -- our "true" customer?
All of this isn't to say that user satisfaction isn't important. At the end of the day, the customer, whoever that may be, will not be happy if the users are banging down her door, rioting in the hallway, screaming in her ear, or otherwise demonstrating discontent with the service. We have to listen to the users; they are the subject matter experts, they do the work of the place. It is tricky business to simultaneously roll out new user satisfaction tools and say that users aren't really the boss.
The problem is that we know we cannot meet their every desire. For us to succeed, we need customers who prioritize, advocate for their users, and communicate with their users when a request does not move forward.
For this to happen, we need to formalize our Business Relationship Management (BRM) processes and develop a clear, (relatively) jargon-free customer outreach packet. In addition to obvious content such as org charts and walk-through of our service catalog, this document articulates the tension between customer service and user demand and defines the relative roles and responsibilities on both sides of the service delivery process.
In the end, we walk a very fine line! But recognizing these tensions is certainly a critical step in helping us keep our balance.
Labels: ITIL, ITSM, Management
History
- The Big Year Begins
- 2014 in Review (Personal)
- 2014 in Review (Professional)
- Alliance Submissions Done
- 8 Weeks to Go
- Hokey but Easy
- Non-Conference Jitters
- Oracle Usability Board - July 2014
- Advising Freshmen
- Confessions of Scrumbut
Archives
- January 2011
- February 2011
- March 2011
- September 2011
- October 2011
- November 2011
- January 2012
- April 2012
- July 2012
- August 2012
- September 2012
- October 2012
- November 2012
- December 2012
- January 2013
- February 2013
- May 2013
- June 2013
- July 2013
- August 2013
- September 2013
- November 2013
- December 2013
- January 2014
- August 2014
- September 2014
- January 2015
- Current Posts


